As mentioned in Part 1 of this Article, there are a few steps needed in order to successfully use any or all of these reporting (Metrics) tools in a useful and productive manner. As previously mentioned, once a person of authority (Process Manager) is in place then he/she can set-up their own approach to using our data. Below is simply one suggested approach used as an example of apply metrics to performance improvements:
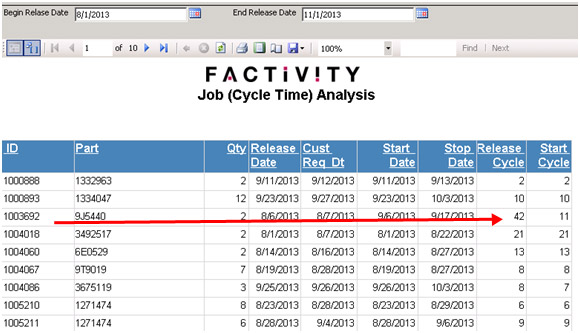
- First step is determine what areas in the factory need to be investigated for possible improvement. For example, is there an indication currently that jobs that are released are waiting too long (See Work Order ID 1003692 in Report below) before getting into production; or that jobs are for some reason waiting longer than appropriate at work centers. Using the data from a Job Cycle Time Analysis can identify these “queue” times from work order release until the first operation becomes active; as well as the total cycle time for the entire time the production order is on the floor, on a job-by-job basis. The Queue Time Metrics reports might be a help in identifying work centers with long wait time as measured by total queue time amount of time the jobs at each work center are waiting at the operation and total expected scheduled run time for each job waiting at the operation (The total amount of scheduled work presently sitting in queue at the operation).
- Second is to look into the operation to see what sort of work stoppages have affected the On Time Delivery. Capture the total problem/down time during each week. Compare the last four-week-period to see if there is some level of consistency from week to week. Work stoppages should be evaluated regularly to investigate whether the loss of time is episodic in nature or one that continues to show up in the metrics. Regular work stoppage time can then be analyzed by “type” from the most to the least time. Discover if large amounts of lost time are occurring as a result of one particular type of down time situation. If so, then maybe a deeper dive is required to evaluate the person/part/ resource (machine) associated with this down time condition to help find the source of the problem.

MES Myths and Mistakes …
Not knowing about the issues surrounding this technology can cost your factory plenty!
Download Now
- Third, is the evaluation of scrap loss and the ramifications of losing production time to scrapped production/parts. This may or may not be a factor affecting On Time Delivery but it should be evaluated. Again, scrap reason should be evaluated weekly for four weeks to determine, the consistency, if any with scrap. Evaluation can be made, like above, for down time with person/part/resource (machine). However, the resolution to lost time with scrap might be accomplished by the use of FACTIVITY “alarms” which can inform a floor supervisor/manager of excessive scrap in real-time to minimize the effect scrap has on lost time and untimely On Time Delivery. Remember, Metrics are an after-the-fact analysis and are not designed and not a good real-time method to improve the timeliness of corrective action.
- Fourth, is the evaluation of performance at the operation. That is, are your operators and assets (resources) working at the expected rate? The expected rate is usually held in the Standard in your ERP System routing file and FACTIVITY can measure the actual performance both in Cycle Time (commonly used in OEE calculations) and Efficiency for each operation of each and every order.
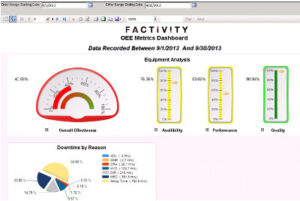 Once a Process Improvement Manager is in place and working regularly on attacking wasted (non-value added time), the OEE Metrics Dashboard (below) can help identify irregularities that might otherwise be undetected and also provide the basis for Plant-to-Plant performance comparisons.
Lastly, the KPI Metrics provided by FACTIVITY are not the only way to get at valuable information from the FACTIVITY data files.
In addition, these same information can be output directly to several preformatted Excel Spreadsheets with the intent on allowing management to massage the data as needed in this ubiquitous analytical tool. Below are a snap shot of some of the Spreadsheets and although the image is hard to read, the columns include important process improvement information such as OEE, Labor, Scrap, Down Time and Job Performance (Cycle Time and Bottleneck).
